Sunday, November 6, 2011

Last post on this blog

Hello all - this is my last post on this blog - my new blog can be found at http://michaeltarallo.com.

Thanks

Mike T

Tuesday, October 4, 2011

"We haven't really thought about that"

If you have been dealing with BI related sales activities or are searching for that "right" BI tool, you will find that most organizations:

* Use manual tasks, including desktop query and reporting tools, to answer their business questions.

* Have "something" in place that they are not happy with or is costing them too much money.

* Have data in multiple silos that they need to access, consolidate and optimize.

Hence, they are usually looking for a low cost BI alternative that can provide them with the answers to their business questions, as well as ease of use and functionality within their budget.

Don't believe me? Join the many BI groups available in LinkedIn and other social networking type sites and you will see the barrage of questions from those looking for recommendations on BI tools.

So...I was on a call yesterday with a well known organization where the "prospect" stated: "We need basic reporting with the ability to access all of our data without moving it or massaging it."

"Okay? That is absolutely possible, however do you understand the pros and cons that are associated with that?" I replied.

[...] Silence...not only can you hear crickets on their phone, but you could hear them in the next conference room over. I took the proverbial saying "Silence is Golden" to another level. It became so uncomfortable that the Account Rep felt he should interject. I interrupted promptly to allow them to answer the question. After about a minute of what appeared to be hours of silence, they responded, "We haven't really thought about that." - BINGO! Case closed! Next!

Hmm... "We haven't really thought about that."

That's the problem, no one is taking the time to be proactive and think about what it is they need and are rather just reacting. "Let's see a demo." "I just need Reporting". "We need Dashboards." If that is the case, I would recommend you watch a video demonstration which may intrigue you to start thinking about what you really need. Then come talk to me when you have more criteria that will support your BI initiative. :-)

So I digress...in turn, I took this as an opportunity to educate by asking pointed questions that would help them see what it is they actually need vs. what they thought they needed.
  • Is the data you need to access all in one location? - No

  • Does the data you have support a majority of questions that will be asked of it? - Don't know

  • Would you like answers to questions that occur on a regular basis? - Yes

  • Would you like your users to answer their own questions on a random basis? - Yes

  • Would you like your users to explore and discover answers to questions they did not think to ask? - Yes

  • Do you have a predefined set of KPIs to manage and track business performance? - Yes

  • Would you like your executives to see an at a glance view of those KPIs? - Yes

  • Would you like to be aware of "something" when a defined threshold is met? - Yes
Alright, now we are getting somewhere. Each of those questions and responses clearly identifies that their needs are more than just simple reporting as originally desired. They require a solution that encompasses both Data Integration and Content Delivery. (ETL, Reporting, Analysis and Dashboards)

I further probed as to why they wanted to access all of the data "without moving it or massaging it". They replied: "Because building a Data Warehouse takes too much time and costs too much money."

Wow! Clearly a response most likely seeded by a competitor whom believes they can access all of the data where it sits, without building a DW. Which may be true for some of the competition out there. However they usually leave out the fact that they are still "moving and massaging" the data - they just don't call it ETL or refer to their process as Data Integration or even use the words "Data Warehousing".

I further explained that Data Integration (ETL) does not have to be about building an EDW, Enterprise Data Warehouse. It can be about building operational data stores that are refreshed periodically to support questions that the business users want to ask. It can involve federated queries where the data is accessed from the source without having to stage the data. It can also be about normalizing data in to a small data mart that supports speed of thought analytics for the power users.

Upon those points I provided a demonstration of Pentaho's "Agile BI" capabilities which involves a rapid, collaborative and iterative approach to building BI applications. At completion of the presentation, the prospect was amazed and pleased. They stated: "This is exactly what we need." Music to my ears.

People, you cannot throw a BI tool in your organization and expect it to stick without asking some important questions. It is those answers that will help guide you to the right solution. And most importantly, you cannot put a BI tool on top of all as-is data without knowing what questions are going to be asked of it. It is impossible to know every question that may be asked, but at least have those that are important to tracking your business performance.

On the majority of calls that I participate in, it seems that organizations don't have the time to properly plan and discuss the criteria needed to implement a decision support system. Why? Because everyone is doing more with less these days and researching a BI tool is usually an ancillary responsibility for them. If that is the case, allow us to help you with your research and we will ask those question you haven't really thought about.

Regards,

Michael Tarallo
Director of Enterprise Solutions
Pentaho

Sunday, September 25, 2011

Using Pentaho to Be Aware, Analyze, Take Action and Protect

Be Aware


Denial of Service attacking (DoS), IP Spoofing, Comment Spamming and Malware programming... are malicious activities designed to disrupt services used by many people and organizations. If you are taking advantage of the internet to run your business, create an awareness of a product or service or simply keep in touch with friends and family, your systems are at risk at becoming a target.

Successful internet "intrusions" can cost you money and even steal your identity. DoS attacks can prevent internet sites from running efficiently and in most cases can take them down. IP Spoofing, frequently used in DoS attacks, is a means to "forge" the IP address and make it appear that the internet request or "attack" is coming from some other machine or location. And Comment Spamming, oh brother...where programs or people flood your site with random nonsense comments and links with an attempt to raise their site's search engine ranking or increase internet traffic to their sites:


"Nice informations for me. Your posts is been helpful. I wish to has valuable posts like yours in my blog. How do you find these posts? Check mind out [link here]"

Huh? - LOL

You may already have defensive measures in place to address some if not all of these things. There are programs, filters and services that you can use to look up, track and prevent this sort of activity. However, with the continuous stream of unique and newly produced malware, those programs and services are only as good as the latest "malicious" activity that is captured. No matter what, it will eventually cause headaches for many people and organizations around the globe. Being able to monitor when something is "just not right" is a great step in the right direction.

Analyze


In September of 2010, I introduced the Pentaho Evaluation Sandbox. It was designed as a tool to assist with Pentaho evaluations as well as showcase many examples of what Pentaho can do. There have been numerous unique visitors to this site, both legitimate and some as I soon discovered...not. Prior to the site's launch, using Pentaho's Reporting, Dashboard and Analysis capabilities, I created a simplistic Web Analytic Dashboard that would highlight metrics and dimensions of the Sandbox's internet traffic. It was a great example to demonstrate Pentaho Web Analytics embedded in a hosted application. Upon my daily review of the Site Activity dashboard which includes a real-time visit strip chart monitor, I noticed an unusually large spike in page views that occurred within a 1 minute time-frame.


Now that spike can be normal, providing a number of different people are surfing the site at the same time. However it caught my attention as "unusual" due to what I knew was normal. The dashboard quickly alerted me of something I should possibly take action on. So I clicked on the point at the peak to drill-down into the page visit detail at that time. The detail report revealed that who or whatever was accessing the Sandbox was rapidly traversing the site's page map and directories looking for holes in the system. I also notice that all the page views were accessed by the same IP address within under 1 minute. Hmmm, I thought. "That could be a shared IP, a person or even a bot ignoring my robots.txt rules." But..as I scrolled down I further discovered there were attempts to access the .htaccess and passwd files that protect the site. I immediately clicked on the IP address data value in the detail report (in my admin version of the report) which linked me to an IP Address Blacklist look-up service. The Blacklist Look-up program informed me that the IP address has been previously reported and was listed as suspicious for malicious activity. BINGO! Goodbye whoever you are!


Take
Action

I quickly took action on my findings by banning the IP address from the system to prevent any further attempts to access the site. I then began to think of some random questions I needed to ask of the data. I switched gears and turned to Pentaho Analysis. Upon further analysis of the site's data using Pentaho Analyzer Report - I was able to see evidence of IP Spoofing and even Comment Spamming coming form certain IP address ranges. The action I took next was to block certain IP address ranges that have been accessing the site in this manner. In addition I created a contact page for those who may be accessing the site legitimately but may have gotten blocked if their IP falls in that range.

Wow, talk about taking action on your data huh?

It is not a question of if, but when an unwarranted attempt will occur on your systems. Make sure you take the appropriate steps to protect them by using the appropriate software and services that will make you aware of problems. My experience may be an oversimplification but it is a great example of how I used Pentaho to make me aware of a problem and take that raw data and turn it into actionable information.

Special thanks to Marc Batchelor, Chief Engineer and Co-Founder of Pentaho for helping me explore the corrective actions to take to protect the Pentaho Evaluation Sandbox.

Regards,

Michael Tarallo
Director of Enterprise Solutions
Pentaho

Monday, September 19, 2011

The right tool for the right job - Part 1

All too Common

You have questions. How do you get your answers? The methods and the tools used to help get those answers to business questions will vary per organization. For those without established BI solutions; using desktop database query and spreadsheet tools are...all too common. And...If there is a BI tool in place, usage and its longevity are dependent on its capabilities, costs to maintain it and ease of use for both development staff and business users. Decreased BI tool adoption, due to rising costs, lack of functionality and complexity may increase dependencies on technical resources and other home grown solutions to get answers. IT departments have numerous responsibilities. Running queries and creating reports may be ancillary, which can result in information not getting out in a timely manner, questions going unanswered and decisions being delayed. Therefore, the organization may not be leveraging its BI investment for what it was originally designed to do...empower business user to create actionable information.

(Read the similar experiences of Pentaho customer Kiva.org here at Marketwire: http://www.sys-con.com/node/1971384)

Six of One, Half a Dozen of the Other

The BI market is saturated with BI tools, from the well known proprietary vendors to the established commercial open source leaders and niche players. There are choices that include the "Cloud", on premise, hosted (SaaS) and even embedded. Let's face it and not complicate things...most, if not all, of the BI tools out there can do the same thing in some form or fashion. They are designed to access, optimize and visualize data that will aid in the answering of questions and tracking of business performance. Dashboards, Reporting and Analysis fall under a category I refer as "Content Delivery". These methods of delivering information are the foundation of a typical BI solution. They provide the most common means for tracking performance and identifying problems that need attention. But..did you know, there is usually some sort of prep work to be done, before that chart or traffic light is displayed on your screen or printed in that report. That prep work can range from simple ETL scripting to provisioning more robust Data Warehouse and Metadata Repositories.

Data Integration

Content Delivery should begin first with some sort of Data Integration. In my 15 years in the BI space I have not seen one customer or prospect challenge me on this. They all have "data" in multiple silos. They all have a "need" to access it, consolidate it, extrapolate it and make it available for analysis and reporting applications. Whether they use it already as second-hand data, loaded into an Enterprise Data Warehouse for historical purposes, or produce Operational Data Stores, they are using Data Integration. Whether they are writing code to access and move the data, using a proprietary utility or even some ETL tool, they are using Data Integration. It is important to realize that not all data needs to be "optimized" out of the gate, as it is not only the data that is important. It is how it will be used in the day to day activities supporting the questions that will be asked. This requires careful planning and consideration of the overall objectives that the BI tools will be supporting.

Well, How do I know what tools to use? - Stay Tuned


With so many tools available, how will you know what is right for the organization? Thorough investigation of the tools through RFIs, RFPs, self evaluation and POCs are a good start. However, make sure you are selecting tools based on the ability to solve your specific current AND future needs and not solely because it looks cool and provides only the "sex and sizzle" the executives are after. The typical need is always Reporting, Analysis, Dashboards. Little realize that there is a lot more to it than those three little words. In the next part of this article I will cover a few of the most common "BI Profiles" that are in almost every organization. In each profile I will cover the Pains, Symptoms and Impacts that plague organizations today as well as the solution strategies and limitations you should be aware of when looking at Pentaho.

Stay tuned!

Regards,

Michael Tarallo
Director of Enterprise Solutions
Pentaho

Tuesday, September 13, 2011

Are you hungry for some Pentaho ETL? Check out the Data Integration Cookbook

Well? Are you? If so, you will want to pick up the Pentaho Data Integration 4 Cookbook by Adrian Sergio Pulvirenti and Maria Carina Roldan published by PACKT Publishing. You may know Mari from Webdetails as well as from her previous book, Pentaho 3.2 Data Integration: Beginner's Guide published in April 2010.

In the PDI 4 Cookbook you will find over 70 "recipes" that will not only answer the most common ETL questions, when working with Pentaho Data Integration, but also guide you through each exercise. Whether you are new to ETL or new to Pentaho, you will find that the Pentaho Data Integration 4 Cookbook accommodates many skill sets, from the novice to the expert. It is a great addition to the growing series of Pentaho books published by PACKT and Wiley.

Chapter 1 introduces you to working with databases and covers step by step how to connect PDI to your data so you can begin extracting, transforming and loading with ease. The chapter even shows you how to work with parameters...a very powerful feature of PDI.

Each section in the book clearly identifies the steps taken to perform the tasks with headers marked "Getting Ready", "How to do it" and then follows up with "How it Works". Very nice for those who need to understand what is happening inside the PDI ETL engine and behind the scenes.

The book continues with topics on working with files, XML, using Lookups, Data Flows, Jobs and goes into integrating Pentaho Data Integration transformations and jobs with the rest of the Pentaho BI Suite, leveraging such things as Pentaho Reports, Pentaho Action Sequences and the Community Dashboard Framework. I especially like the topics that are covered in Chapter 8; using Pentaho Data Integration with CDA (Community Data Access) and CDE (Community Dashboard Editor). This topic depicts greater extensibility of the Pentaho software by working with powerful Pentaho plug-ins contributed by Webdetails.

The book concludes with Chapter 9, which helps you get the most out of Pentaho Data Integration, by explaining how to work with PDI logging, JSON, custom programs and sample data generators.

If you are exploring the world of Pentaho, I would highly suggest picking up this book. It is great for beginners and for those experts (myself included) who thought they knew everything there was to know about Pentaho Data Integration and were pleasantly surprised by the additional knowledge gained.

Get started and download Pentaho today.

Read more about the authors at blog.pentaho.com

Recipe for a lower TCO and Higher ROI:

  • Gather needs and requirements
  • Take 1 Pentaho Installation
  • Add your data
  • Add Training
  • Can substitute: Pentaho Sales Engineering, Consulting or a Pentaho Certified Network Partner
  • Prepare a Scope of Work
  • Communicate Effectively
  • Execute Accordingly
  • Sit back and enjoy your lower TCO
Regards,

Michael Tarallo
Director of Enterprise Solutions
Pentaho


Thursday, July 7, 2011

Pentaho Data Integration and the Facebook Graph API

Social Networking Data

Recently, I have been asked about Pentaho's product interaction with social network providers such as Twitter and Facebook. The data stored deep within these "social graphs" can provide its owners with critical metrics around their content. By analyzing trends within user growth and demographics, and consumption and creation of content, owners and developers are better equipped to improve their business with Facebook and Twitter. Social networking data can be viewed and analyzed utilizing existing tools such as FB Insights or even purchasable 3rd party software packages created for this specific purpose. Now...Pentaho Data Integration in its traditional sense is an ETL (Extract Transform Load) tool. It can be used to extract and extrapolate data from these services and merge or consolidate it with other relative company data. However, it can also be used to automatically push information about a company's product or service to the social network platforms. You see this in action if you have ever used Facebook and "Liked" something. At regular intervals, you will note unsolicited product offers and advertisements posted to your wall or news feed from those companies. A great way to get the word out.

Interacting with these systems is possible because they provide an API. (Application Programming Interface) To keep it simple, a developer can write a program in "some language" to run on one machine which communicates with the social networking system on another machine. The API can leverage a 3GL such as Java or JavaScript or even simpler RESTful services. At times, software developers will write connectors in the native API that can be distributed and used in many software applications. These connectors offer a quicker and easier approach than writing code alone. It may be possible within the next release of Pentaho Data Integration, that a Facebook and/or Twitter transformation step is developed - but until then the RESTful APIs provided work just fine with the HTTP POST step.


The Facebook Graph API

Both Facebook and Twitter provide a number of APIs, one worth mentioning is the Facebook Graph API (don't worry Twitter, I'll get back to you in my next blog entry).

The Graph API is a RESTful service that returns a JSON response. Simply stated an HTTP request can initiate a connection with the FB systems and publish / return data that can then be parsed with a programming language or even better yet - without programing using Pentaho Data Integration and its JSON input step.


Since the FB Graph API provides both data access and publish capabilities across a number of objects (photos, events, statuses, people pages) supported in the FB Social graph, once can leverage both automated push and pull capabilities.

Tutorial: Publishing content to a Facebook Wall Using Pentaho Data Integration


The following is an example of a reference implementation to walk you through the steps to be able to have Pentaho Data Integration automatically post content to a FB Wall.

It is broken down into the following steps:

  1. Create a new FB Account

  2. Create a new unique FB user name

  3. Create a new FB application

  4. Obtain permanent OAUTH access token

  5. Create PDI transformation
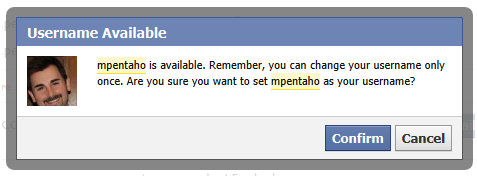


Step 1: Created a new FB account

http://www.facebook.com


Step 2: Follow Instructions to setup your unique username

http://www.facebook.com/username/


Add your own - or accept the defaults.


Example: facebook.com/mpentaho
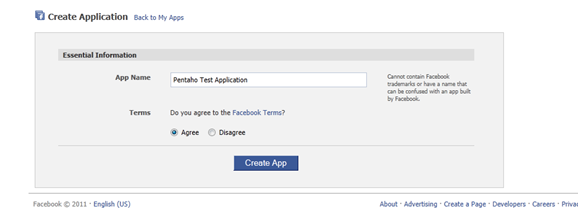


Step 3: Create a FB Application

http://www.facebook.com/developers/createapp.php


Allow "Developer" access to your basic information.


After you allow access to the Developer App - go back here: https://www.facebook.com/developers/createapp.php if it does not redirect you.

Create Application


Security Check


Verify Information


Click Web Site


Note your application ID and Application Secret

Examples:

Application ID: xxxxxxxxxxxxxxx

Application Secret: yyyyyyyyyyyyyyyyyyyyy

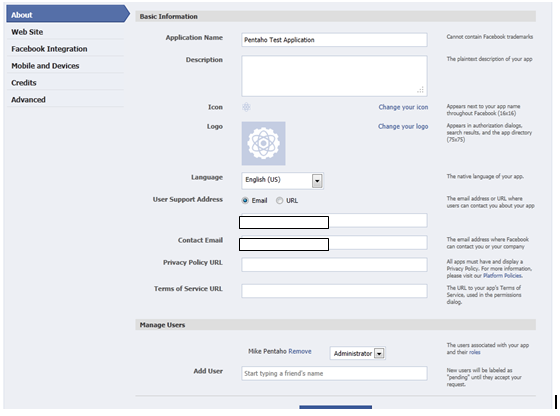
Enter your Site URL and Site Domain, this can be pretty much anything, but attempt to use your real information if available.


Note Settings, App ID, API Key and App Secret


Note: From here you can follow the link below for a detail tutorial on setting up permanent OAUTH access:

http://liquid9.tv/blog/2011/may/12/obtaining-permanent-facebook-oauth-access-token/

Below summarizes those steps:

Step 4: Obtain Permanent OAUTH Access Token:

Create and execute the below URL in your browser: Modify the below URL to use your client_id and redirect_uri - see notes in blog post link above set permission values accordingly. (http://developers.facebook.com/docs/authentication/permissions/)

Your client_id is your App ID and the redirect_uri can be anything.

Sample URL:
https://graph.facebook.com/oauth/authorize?client_id=...&redirect_uri=http://wordsofthefamily.com/&scope=read_insights,offline_access,publish_stream,create_event
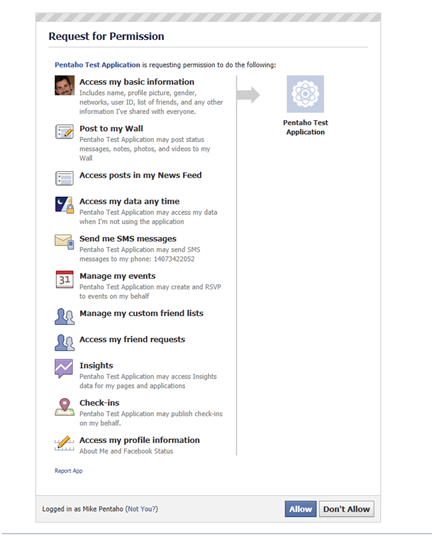
Constructed URL:
https://graph.facebook.com/oauth/authorize?client_id=xxxxxxxxxxxxxx&redirect_uri=http://wordsofthefamily.com/&scope=read_insights,offline_access, publish_stream,create_event,rsvp_event,sms,publish_checkins,manage_friendlists,read_stream,read_requests,user_status,user_about_me

You will get the following screen - yours might be different depending on what permissions you selected - make sure at least that "Post to my Wall" is there.
If not verify your permissions based of off the permission link in the blog post.

Click Allow


Now note the URL that was created in the browser address bar and that you were redirected to your page that you placed in the redirect_url.

You need the code value.


The code parameter will be a very lengthy string of random characters. Copy this value and hang on to it for the construction of a new URL.

This URL will turn the generated code into a valid access token for your application.

Sample of what is returned:
http://wordsofthefamily.com/?code=fdfdfdfdfdfeereghyjj.eyJpdiI6IjczU2YwUVJmaUJocXJjM1plOUdzVVEifQ.psncSCrwu-1659AZCHd7UBpUdBYdKCmvwXSu2-WxLcxfRt6wtwKzcjYkblwshjbnRX0EhcSrbG_U83AOv9pDrfomcLB8SY3gH1VW083oM997NqM28czfeaWpd8uv6sjE

CODE Example: fdfdfdfdfrert-8Qoj7wFkUqoCKWSEk89aCwd2zM.eyJpdiI6IjczU2YwUVJmaUJocXJjM1plOUdzVVEifQ.psncSCrwu-1659AZCHd7UBpUdBYdKCmvwXSu2-WxLcxfRt6wtwKzcjYkblwshjbnRX0EhcSrbG_U83AOv9pDrfomcLB8SY3gH1VW083oM997NqM28czfxxxrrer


Now Create the Following:

https://graph.facebook.com/oauth/access_token?client_id=...&client_secret=...&redirect_uri=http://liquid9.tv/&code=...

Fill in your application ID, application secret, redirect uri, and the code we just copied. Again, ours looks like this:

Constructed:
https://graph.facebook.com/oauth/access_token?client_id=xxxxxxxxx&client_secret=yyyyyyyyyyyyyyy&redirect_uri=http://wordsofthefamily.com/&code=xxxxxxxxxxx9_A-8Qoj7wFkUqoCKWSEk89aCwd2zM.eyJpdiI6IjczU2YwUVJmaUJocXJjM1plOUdzVVEifQ.psncSCrwu-1659AZCHd7UBpUdBYdKCmvwXSu2-WxLcxfRt6wtwKzcjYkblwshjbnRX0EhcSrbG_U83AOv9pDrfomcLB8SY3gH1VW083oM997NqM2xxxxxxxxxx

You will get back an access token:
access_token=1111111332444877557776746ghhg758d8f970bd1cbc17.1-100002640151006|d9WWkjxODcel0ZVIZfMEv5YKc10 

Now you should be able to use PDI and the HTTP POST step using the various FB GRAPH APIs to do things: http://developers.facebook.com/docs/reference/api/ such as posting content to the FB wall / news feed and etc.

Step 5: Created a PDI Transformation using the HTTP POST step and the FB Graph API with /PROFILE_ID/feed

  1. Create a new Transformation

  2. Use a Generate Rows Step (found under Input) to set the various Facebook parameter names that can be found here
    http://developers.facebook.com/docs/reference/api/post/

  3. Make sure to use the access_token parameter and value you got from the steps above

  4. Add HTTP Post step (found under Lookup) and connect hop from Generate Rows

  5. Configure the HTTP Post step to use the feed RESTful service https://graph.facebook.com/mpentaho/feed
    Refer to http://developers.facebook.com/docs/reference/api/ Publishing section for list of methods
    Replace mpentaho with your unique user name you set up earlier


  6. Jump to the Fields tab and click "Get Fields" under the "Query parameter" panel

  7. Click OK, Save and right click on the HTTP Post Step and select Preview, then Quick Launch

  8. In a few seconds a panel should come up displaying your data

  9. Check the result column (at the end) and look for a return code such as:
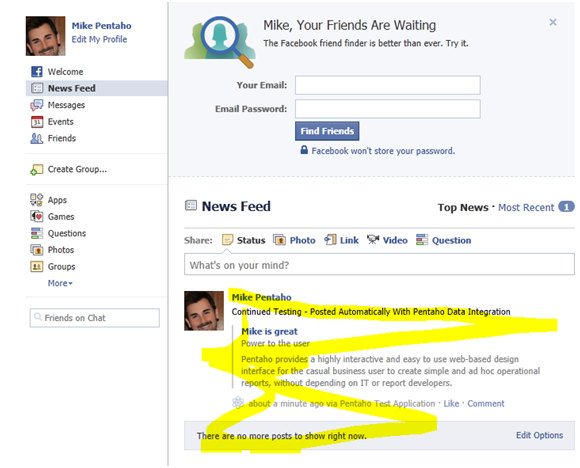
    Example: {"id":"100002640151006_100565053374833"}

  10. Check your newly created Facebook account wall and you should see

  11. If not check your FB account security and application privacy settings to ensure the application has access.


Regards,

Michael Tarallo
Director of Enterprise Solutions
Pentaho

Monday, June 27, 2011

Pentaho Report Bursting with Pentaho Data Integration

Originally posted on the Pentaho Evaluation Sandbox

Report bursting is the process of sending personalized formatted results derived from one or more queries to multiple destinations. Destinations can be file systems, email distribution lists, network printers or even FTP hosts. Allowing a greater method of distribution. Usually, the end result will display information pertinent to the recipient or location; therefore each recipient only sees their own data. Below is a brief example of how Pentaho Report Bursting can be achieved with Pentaho Data Integration 4.2. By leveraging Pentaho Data Integration's new Pentaho Reporting Output step, once can create a simple tasks that executes and renders multiple reports from a single Pentaho Report template. This is a truly powerful example of how Pentaho Data Integration can be used for more than just ETL.

Special thanks to Wayne Johnson, Senior Sales Engineer for providing the sample and setup document.

How To document and sample here

Tuesday, May 31, 2011

Configuring Pentaho to use LDAP

Before you Begin

The following tutorial should be used to setup a simple reference implementation of the Pentaho BI Server configured with LDAP authentication. The prerequisites needed in order to be successful with this tutorial include an existing installation and usage of the Pentaho BI Server and Enterprise Console, a simple understanding of LDAP and the ability to follow standard installation procedures using install wizards. The tutorial is represented from a Windows operating system perspective, but is applicable across multiple platforms. It is recommended that you get the reference implementation working successfully before configuring your Pentaho BI Server to use your own LDAP configuration.

The rest can be found here at the Pentaho Evaluation Sandbox.

http://sandbox.pentaho.com/2011/05/configuring-pentaho-to-use-ldap/

Saturday, May 21, 2011

Spatial Reporting with Pentaho and Google Maps


Pentaho Experience Level: Medium to Advanced

Spatial or also known as Geographical Reporting, is a great way to answer the question: "Where are my....(fill in the blank here)?" It is a great way to visualize the spatial or location component of your data (Latitude, Longitude, Country, County, Region, City, State, Zip Code etc). It can also tell you where the lowest or highest concentration of a desired metric may lie with the use of color gradients or conditionally styled points. The ability to drill in even deeper, allows you to eliminate the surrounding areas and focus your attention on the areas that may need it most. The Pentaho BI Platform can take advantage of 3rd party visualization solutions such as the Google Maps API and integrate it as a component that can be used with the Pentaho User Console.

Read more and come see and example in action here: http://sandbox.pentaho.com/samples-and-examples/samples-and-examples/dynamic-google-maps-widget/

Regards,

Michael Tarallo
Director of Sales Engineering
Pentaho

Monday, May 9, 2011

Unlocking Non-Relational Data with Ease

Pentaho Reporting can easily access data from many different sources; sources such as your traditional RDBMS, and even more advanced sources such as Java, XML, OLAP and our own Pentaho Data Integration transformations. Download these brief instructions (.doc) or watch the Techcast to learn how easily you can use a Pentaho Data Integration Transformation as a data source within the Pentaho Report Designer to unlock the power of non-relational data.

View the Techcast here.

Download document AND sample .ktr and .prpt files here.

To use the sample:

  • Unzip *.zip file

  • Copy Files to temporary folder

  • Use Report Designer and Open the PRPT file (the .ktr is already embedded in it)

  • Preview

  • Publish to Pentaho User Console as you would with any other Pentaho Report

  • Optional: Import .ktr file into PDI to see the simple transformation

Contributed by,

Wayne Johnson
Senior Sales Engineer
Pentaho

Originally posted on the Pentaho Evaluation Sandbox:

http://sandbox.pentaho.com/2011/05/unlocking-non-relational-data-with-ease/

Tuesday, March 29, 2011

High Availability and Scalability with Pentaho Data Integration

Data

Experts often possess more data than judgment. - Colin Powell. Perhaps because they did not have a highly scalable Business Intelligence solution in place to assist them with their judgment. :-)

Data is everywhere! The amount of data being collected by organizations today is experiencing explosive growth. In general, ETL (Extract Transform Load) tools have been designed to move, cleanse, integrate, normalize and enrich raw data to make it meaningful and available for potential decision makers. Once data has been "optimized", it can then be turned into "actionable" information using the appropriate business applications or Business Intelligence software. Significant information could then be used to discover how to increase profits, reduce costs or even suggest what your next movie rental on Netflix should be. The ability to pre-process this raw-data before making it available to the masses, becomes increasingly vital to organizations that must collect, merge and create a centralized repository containing "one version of the truth". Having an ETL solution that is always available, extensible, flexible and highly scalable is an integral part of processing this data.

Read more here at the Pentaho Evaluation Sandbox:
http://sandbox.pentaho.com/2011/03/high-availability-and-scalability-with-pentaho-data-integration/

Regards,

Michael Tarallo
Senior Director of Sales Engineering
Pentaho

Saturday, January 22, 2011

Guided Ad hoc 2.0 with Pentaho 3.x

A barrier that may be encountered when adopting a Business Intelligence tool is...ease of use. If the BI tool is too difficult for business users to use or understand, they may resort back to using antiquated desktop databases and spreadsheets. If the new BI tool is not being used to the best of its abilities, then the organization is not leveraging their BI investment. Therefore its dreams of consolidating information and delivering one version of the truth just went out the window. **CRASH** Sure training, mentorship and education can help with this barrier, however there are many individuals that are simply resistant to change. What if there was another way to provide robust reporting capabilities without a steep learning curve? Possibly with the creation of templates designed for a specific purpose? Let's leave the Dashboards, Ad hoc query and OLAP tools for the experts and provide a simpler way for the technically challenged to run and create reports.

Read more about it here and watch the tutorial and download the sample:
http://sandbox.pentaho.com/guided-ad-hoc-with-pentaho-reporting/

Wednesday, January 12, 2011

Pentaho Reporting and Pentaho Analysis

The Pentaho BI Suite consists of the following BI modules: Reporting, Analysis, Data Integration, Dashboards and Data Mining. The modules can be deployed as an entire package or as individual components that can be integrated and embedded. Traditionally, each module is used in conjunction with a specific business need. The focus of this article will be to highlight the differences and similarities between Pentaho Reporting and Pentaho Analysis. Most organizations already have some form of Operational Reporting and Analysis tools. These tools are used for tracking business performance, trends and uncovering potential problems that require action. Business questions usually fall into a few categories. Questions that are asked on a regular basis for certain time periods (years, quarters,months, weeks) and questions that are asked for a purpose - usually random in nature, posed to uncover potential problems or outliers and can be commonly referred to as Ad hoc queries or OLAP Analysis.

Read more here: http://sandbox.pentaho.com/2011/01/pentaho-reporting-and-pentaho-analysis/

Thursday, January 6, 2011

See you in San Francisco at the Pentaho Global Partner Summit

It is only the 6th of January and already this has been a crazy month.

"Crazy" as in crazy busy. I'm sure you have heard the phrase before, but then again it depends on what industry you are in. A down economy has certainly not affected the Commercial Open Source space, I can tell you that.

To add to all the excitement, on January 19th and 20th is our Global Partner Summit in San Francisco at the Presido Golden Gate Club.

CTOs, architects, product managers, business executives and partner-facing staff from System Integrators and Resellers should attend this event. You can register and find out more here: Global Partner Summit

There will be technology tracks, business tracks, Q&A discussion panels and more for all to take part in. This year I am honored to join the team to present a couple of topics that surely should not be missed.

Sales Engineering will be holding sessions that will show you how you can brand and customize the default Pentaho User Console. I will also present how adding "Guided Ad hoc" to your applications can provide business value to those who are not so accepting of the out-of-the-box tools.

You can view the full agenda here

I look forward to speaking with many of you as well as, once again ,visiting my home away from home...San Francisco.

See you there.

Michael Tarallo
Director of Sales Engineering
Pentaho

Wednesday, January 5, 2011

Pretty is not a decision maker

"Beauty is only skin deep." "Physical beauty is superficial." Blah, Blah, yeah I know, I am sure you've heard it all before.... and "No" they are not phrases coined by some "ugly duckling" in an attempt to make it feel better about itself. However, physical characteristics will always play a part in how we as humans are initially captivated and intrigued. It's true for how most of us consider our mates... it is even true for how some organizations consider BI software.


When I was with a proprietary BI vendor (before the explosive disruptive model of Commercial Open Source BI), I spent 3 weeks on site with a prospect conducting a POC (Proof of Concept). It was well received for both its data integration and information delivery functionality. However, even though we had specific data integration capabilities that surpassed the competition, we still lost because the business users liked the competition's "Prettier Dashboards". The first thing out of the IT Director's mouth was... "Well, we went with "Vendor B", their dashboards just looked better." Completely disregarding the specific EDI integration that we brought to the table. Huh..I pondered for a few minutes...scratching my head with a puzzled look. Cocking my head slightly to one side I rebutted, "That's disappointing, since when did 'Pretty' become a decision maker?" The Sales Rep looked over at me and smiled. That was over 5 years ago.

More recently, inspired by a colleague of mine, Gabriel Fuchs and his web post Data Visualization – Cool is Not a Key Driver! - I am still overwhelmingly surprised how much emphasis organizations put on the importance of "having nice looking dashboards" without really knowing what is involved under the covers. Further more they have a tendency to not know what charts or visualizations should "go" with "what" data. (You'll be surprised at how many simple line charts are used incorrectly or when to use or not use a pie chart) I have heard so many colorful descriptions I had to wonder if they really understood the business value behind a BI solution at all. From dashboards that are "Nice and Friendly" to those that are "Fancy, Sexy, Sizzle and In your face". At times I was wondering if they were describing their ideal mate or the latest and greatest automobile.

All too often, IT or the occasional business user will start researching BI solutions and stumble upon a software package that appears to do what they need. Perhaps they were able to get a "Fancy" dashboard up and running quickly. Soon they may find that the proposed solution is either too costly, not scalable, only runs on Windows, cannot access all their data easily or perhaps only provides dashboards and lacks other critical BI functionality. They may have been initially captivated by the Siren's music but soon realize that the "Fancy" dashboard was just skin deep. 1 out of every 10 calls that I am on reveals that the prospects are only looking for just dashboards. When further discovery takes place, it is also learned that the "dashboard only" deployment is usually for just a few users and localized departmental data, not exactly an Enterprise wide solution. The rest of the prospective calls are looking for Dashboards as well as Reporting, Analysis and more often than not, Data Integration. I mention Data Integration as well because these organizations have disparate data sources on many different platforms. They are looking to easily access, optimize and visualize this data that will be able to answer today's questions as well as tomorrow's questions, perhaps across the entire data set - not just a small slice.

Here are some important facts to remember:

  • Most business users do not understand the value of BI
  • It is important to show how BI can help knowledge workers do a better job
  • IT cannot just throw a BI application at the wall of business users and hope it sticks
  • BI is NOT a technology tool
  • BI involves specific business processes
  • BI applications can both drive revenue growth and can also reduce costs to optimize profits
  • Do NOT assume that Subject Matter experts understand BI and its potential
Here are some key questions an organization should ask before they begin the process of finding a BI solution provider:

  • What is your definition of a successful evaluation?
  • What data is needed in order to…..?
  • Where is the data I need in order to….?
  • How easily can I access all that data?
  • Do I have the proper skill sets to deploy a BI Application?
  • Do I want my business users to ask Ad hoc questions?
  • What questions do I or my business users want to ask of the data?
  • Do I need Operational reporting including schedule and distribution?
  • What have I found from my existing BI application(s)?
  • What actions do I want to take from my findings?
I hope you now realize that there is a lot more involved than just that "Pretty Dashboard".